Knowing the current operational status of your local network equipment can be critical in a field response situation (such as an ARES or RACES activation). So YAAC provides a means to conveniently collect the status of a selected set of stations in a simple display.
There are currently six types of stations whose operational status can be monitored:
Note that a station can be more than one type simultaneously (ex.: an APRS station reporting weather data).
To monitor stations, select the View->View Health Monitor menu choice. The window that appears has four views in it. To set up your list of stations to be monitored, select the fourth tab:
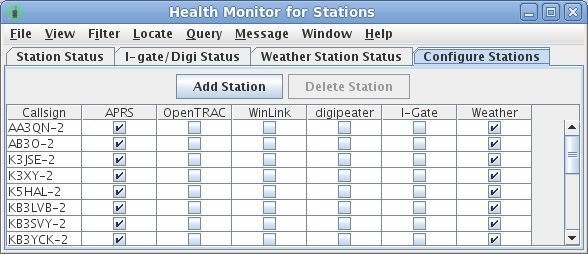
Click the Add Station button to specify the callsign of a station to be monitored (you do not have to currently be able to see this station). Enter the callsign-SSID of the station in the callsign column, then click the checkboxes for all types of operation you want to have checked. You may modify the types for currently listed stations at any time.
Once a station is monitored, you can view it on any of the other tabs that corresponds to the selected types. You may also stop monitoring a station by selecting its row in the configuration table and clicking the Delete Station button.
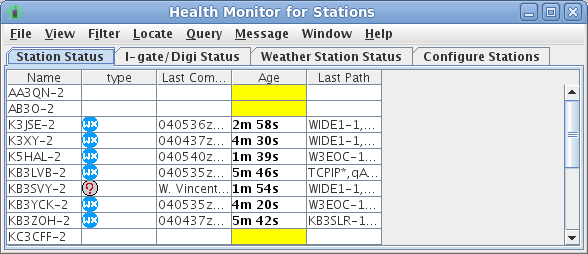
The Station Status tab shows how long it has been since the station transmitted a message on its own behalf (as opposed to digipeating or I-gating some other station's traffic). Any station who has not transmitted its own traffic for more than 30 minutes is flagged in red ; if older than 15 minutes, it is merely flagged in yellow . If the messages being monitored for a station have timestamps and those timestamps are in the future (typically due to crossing a timezone boundary or setting daylight savings time incorrectly either remotely or locally), the station is flagged in purple .
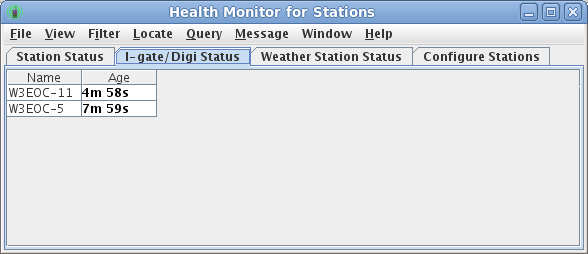
The I-Gate/Digi Status tab shows how long since the station has relayed a message from some other station, using the same color-highlighting scheme.
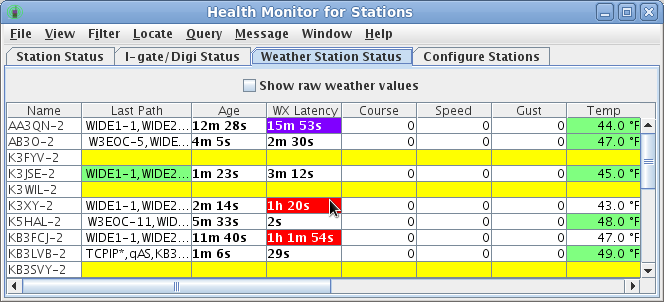
The Weather Status tab shows the last-reported weather data for the station (blank columns were not reported by the particular station). The age columns show the time since a weather message was last received from the station, and the age of the weather data in that message (may be different from the receive age if the weather message was timestamped by the weather-sending station). In addition to the red and yellow background colors used to flag old weather data, purple is used to flag weather data with a timestamp in the future (i.e., a misconfigured clock on the weather station). In addition (regardless of its age), the actual numeric value of a weather parameter may also appear in red if it appears to violate the US National Weather Service's MADIS quality check standards, to the extent that YAAC implements the following checks: